How to use the Butterfly pattern in trading?
Imagine a butterfly gracefully flitting from one flower to another, its unique pattern and symmetry drawing attention from anyone who beholds it. In the trading realm, one pattern that may attract traders globally is the Harmonic Butterfly Pattern in trading. Let’s dive into this trading pattern, understanding its details and the visual charm it brings to the charts.
Meaning of Harmonic Butterfly Pattern in Trading
The harmonic butterfly pattern, much like its namesake in nature, is about symmetry and precision. It is a price structure that’s identified by specific Fibonacci retracement levels that may assist with potential future price reversal assessments. The Harmonic Butterfly Pattern can be fascinating, combining artistic elements and mathematical concepts within the trading realm.
Spotting and Implementing the Butterfly Pattern in Trading
The dance of the butterfly pattern in trading can be spotted across many time frames, from minutes to months. So how can you identify it?
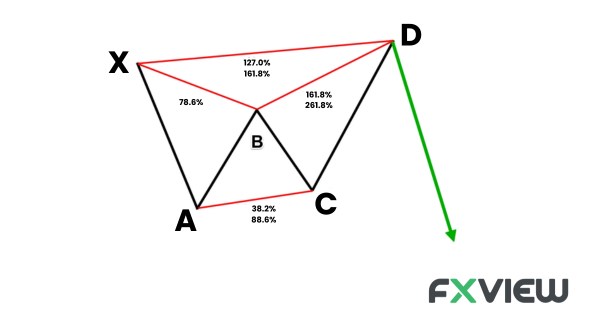
X to A: The pattern starts with a definitive price move. Imagine this like a butterfly unfurling its wings for the very first time.
A to B: There’s a correction from the initial X to A leg. Typically, it retraces about 78.6% of the initial move.
B to C: Price moves again, but this time it’s either a shallow pullback or even an extension of the A-B leg.
C to D: This is where the magic happens. If the butterfly is to take flight, the price will move to a point where it extends the X-A leg by between 1.618 and 2.618.
In the world of forex trading, the harmonic butterfly pattern can play an important role as it can potentially indicate areas where price reversals might take place.
Potentially Bearish Butterfly Chart Pattern
Much like the changing seasons, the markets are not always sunny. When storm clouds gather, the Bearish Butterfly takes flight. The pattern completes at a bearish X to A swing. When the D point is formed, traders may see it as a potential signal for a short-selling opportunity.
Potentially Bullish Butterfly Chart Pattern
After the rain, the sun shines bright, and the bullish butterflies come out to play. The butterfly pattern in trading may indicate a potential buying opportunity when it completes at a bullish X to A leg. Traders, with their nets ready, wait for this pattern to take shape, hoping to catch the uptrend at its inception.
Forex Trading with the Butterfly Pattern: Examples of approaching the pattern
- Spotting the Pattern: As discussed, watch out for the specific legs and the Fibonacci retracement levels.
- Setting Stop-Loss: Setting Stop-Loss Orders may potentially assist with the limitation of losses.
- Taking Profit: Aim for a retracement back to the C point or even the B point.
Example: Imagine the EUR/USD currency pair is showcasing a potentially bullish butterfly pattern on the daily chart. This pattern hints at a possible shift after a recent downtrend. As a trader, you can initiate a long position at the completion of the D point, set a stop-loss just below the lowest point of the pattern, and target profits around the C or B point.
Butterfly Pattern: Advantages and Disadvantages
Pros:
- Potentially helpful: Once identified correctly, the butterfly pattern in trading may assist with the assessment of potential opportunities.
- Clear Entry and Exit Points: The structure of the pattern can provide clear spots for both trade entries and exits.
- Can work Across Timeframes: Whether you’re a scalper or a swing trader, the butterfly may help you build your trading strategy.
Cons:
- Complex Identification: It requires a keen eye and understanding of Fibonacci levels.
- Not Foolproof: Like all patterns, it doesn’t guarantee success 100% of the time, therefore you should always consider whether you can afford the risk
Key Takeaways
- The butterfly pattern in trading weaves together art and maths, aiding traders in indicating potential reversals.
- Identifying the butterfly pattern in trading requires understanding of the specific legs and Fibonacci retracement levels.
- Whether the market mood is potentially bullish or bearish, there’s a butterfly pattern which may assist with potential opportunities assessment.
- Like any trading approach, it’s important to control risk by setting clear stop-loss and take-profit points.
Trading, much like nature, is about patterns, rhythms, and understanding the dance of numbers. The butterfly pattern is just one of many patterns in the vast ecosystem of trading.
Disclaimer: The information contained in this article is provided for educational and informational purposes only and it is not intended to be, nor does it constitute financial, investment or trading advice. You should not make any financial, investment or trading decision based on the information provided in this article without performing your own research or seeking advice from an independent advisor.
Related Posts

Volatility in forex trading

How To Use The Bat Pattern In Trading?