
Type of Charts in Forex
Today we’re diving into the dynamic world of Forex trading, specifically focusing on the unsung heroes of this arena: the type of charts in Forex! Like a seasoned mariner with a trusted compass, forex traders take into consideration the different type of charts in Forex to navigate the vast ocean of market currency exchange. Ready to dive into Forex charts? Let’s dive into these charts. They’re like your trading compass, guiding you to make smarter choices. Ready to learn? Let’s go!
First off, a quick insight for our newbies. What do you understand about these types of charts in Forex? Forex charts show how currency prices move. Different types of charts in Forex show various angles of the market. Like different lenses, they may help traders spot potential trends and decide their moves. Dive in, see the bigger picture, and make your play with the right type of charts in Forex. Let’s take a quick tour!
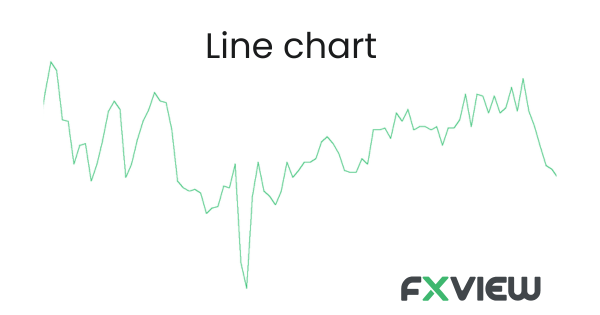
A. Line charts: Think of line charts as a minimalist’s dream and a fundamental type of charts in Forex. They’re the most basic type of Forex chart, plotting the closing prices over a specific period. A line connects one closing price to the next, creating a simple, clean snapshot of price movement over time. Helpful when you want a no-frills, straightforward view of the market using a basic type of charts in forex.
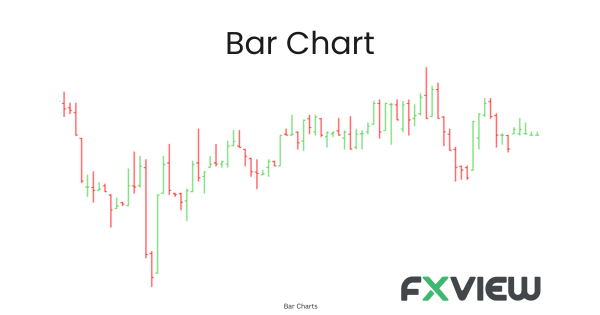
B. Bar charts: Also known as OHLC (Open, High, Low, Close) charts, bar charts are when you crave a bit more detail from the type of charts in Forex. Each bar represents a period (like a day or an hour) and shows the opening, closing, high, and low prices. They’re like a detective novel – you get a lot more juicy information about what’s happening, thanks to the descriptive nature of this type of chart in Forex.
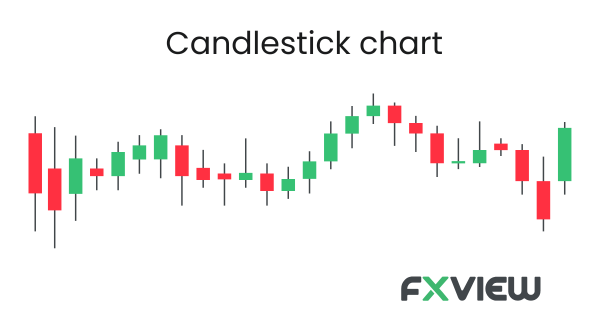
C. Candlestick charts: Candlestick charts give the same information as bar charts but in a more visually detailed manner. Each candlestick shows potential price movement in a period and changes colour according to whether the market is bullish (rising) or bearish (falling). They’re as fun as they can be useful and a popular type of charts in forex!
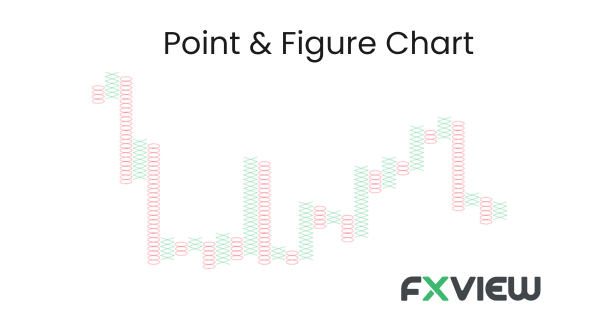
D. Point & Figure Charts: Point & Figure charts are like a Zen garden in the middle of a bustling city. They ignore time and only change when a specific amount of price movement has occurred. These charts filter out short-term ups and downs, showing clearer long-term trends. This could help you make calmer trading choices with this distinct type of charts in Forex.
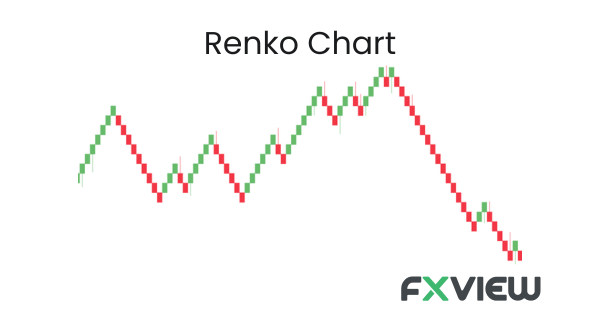
E. Renko Charts: Renko charts follow the simple philosophy of bricklaying: you lay a new brick (or in this case, draw a new box) only when the price moves a certain amount. Renko, derived from the Japanese word “renga” for brick, provides an easy-to-follow, step-like visualization of price trends and is a unique type of charts in Forex.
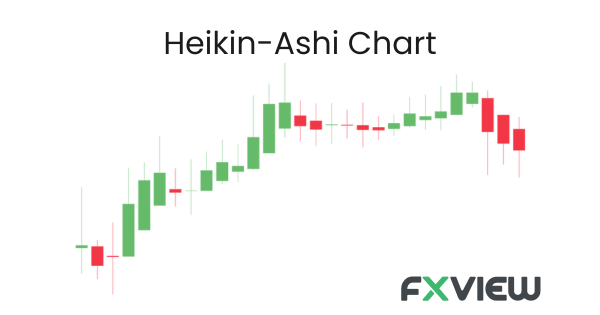
F. Heikin-Ashi Charts: Ready to experience tranquillity in the bustling Forex market? Meet the Heikin-Ashi charts! A variation of candlestick charts, use averaged price data to create a smoother visualization of price trends. Like the calming strokes of a Zen master’s brush, Heikin-Ashi charts may help traders to spot potential trend reversals and are a serene type of charts in Forex.
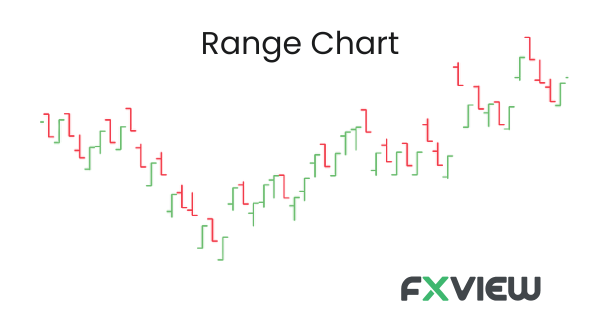
G. Range bars: Imagine trying to listen to a symphony in a noisy crowd. Difficult? That’s where range bars come to the rescue in our trading world! Range bars take only price into consideration, meaning each bar represents a specified movement of pips. They expertly filter out minor fluctuations, providing a smoother picture of the overall trend. It’s like enjoying your symphony in a quiet room – all the music, none of the noise, with this specialized type of charts in forex.
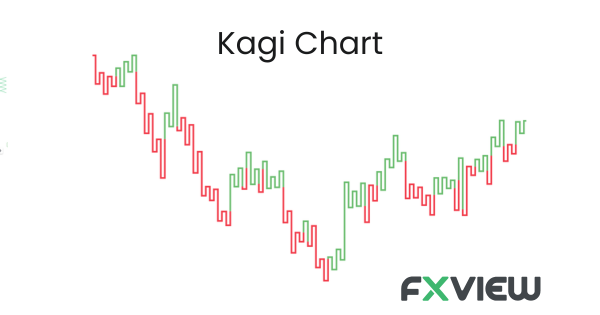
H. Kagi Charts: Last but not least, meet the Kagi charts, the breakout spotters of the Forex world. A Kagi chart is a type of chart that measures supply and demand, and it changes direction only when the price moves a certain amount. It’s like having an eagle eye for breakouts – nothing escapes its view in this decisive type of charts in forex!
I. Tick Charts: For the ones among us who have an insatiable appetite for detail, tick charts could serve as a fantastic ally. Instead of time intervals, these charts represent a specific number of transactions or ‘ticks’. It’s like having a microscope aimed at market activity, showing you every single trade with this intimate type of chart in Forex. Talk about having a front-row seat to market action!
Key Takeaways
- Before delving deep, get familiar with the simplest type of charts in Forex – the line chart. It’s great for getting a clear and uncluttered view of market movement.
- When you need more in-depth information, you may consider turning to bar charts (OHLC) and candlestick charts. These can provide insights into open, high, low, and close prices within specific time frames.
- Use Point & Figure and Renko charts for identifying and following trends by filtering out minor price movements and focusing on significant shifts.
- For a less noisy and more flowing representation of market trends, Heikin-Ashi charts can offer averaged price data for better clarity in trend analysis.
- Range and Kagi charts may help to disregard the factor of time and instead focus solely on price movements, helpful for clear-cut visual cues in volatile markets.
- Tick charts are popular for their detailed portrayal of every transaction, giving you the granular details of market activity.
- Don’t limit yourself to one type of chart in Forex. You may consider using different charts in combination to get various perspectives on the market.
- Spend time interpreting the type of charts in Forex as each has its language. Mastery comes from understanding the story each chart tells.
Conclusion
That’s quite a repertoire of chart types we’ve covered. Every graph narrates its own tale with the type of charts in Forex. Choose the option that aligns with your trading approach and objectives. Don’t be afraid to mix and match the type of charts in Forex, and enjoy the process as you learn!
Happy trading!
Disclaimer: The information in this article is provided for educational and informational purposes only and is not intended to be, nor does it constitute financial, investment or trading advice. You should not make any financial, investment or trading decision based on the information provided in this article without performing your own research or seeking advice from an independent advisor.
Related Posts

Bear and bull market in Forex
5 Common Mistakes In Forex Trading To Learn From