
Technical Analysis in the Forex
Understanding the importance of making smart decisions is something that investors and traders in the finance world really get. Think of Technical Analysis in the Forex Market a kind of tool that may help us spot patterns and trends in stock prices by looking at what’s happened before. This blog will explore technical analysis: what it is, why it matters, how it can be used, what it cannot do, and how it compares to fundamental analysis. So let’s explore the world of charts and technical analysis in the forex market right away!
What is Technical Analysis?
The key to Technical Analysis in the forex market is looking…at what happened before – the prices and trading volumes in the past. It’s kind of like reading the market’s mind – understanding how people are thinking, who’s doing the buying and selling, and recognizing those patterns that keep cropping up. Technical Analysis could be like cryptic code, decoding the language of the market and potentially revealing its hidden messages.
Why does Technical Analysis in the Forex Market matter?
Think about this: at times investors get so caught up in the details that they neglect the big picture, sort of like missing the forest because of all the trees. It may help us take a step back and get the full view.
When we dig into how prices behaved in the past, it’s like peering into the collective mood of the market. In addition, it may give us an idea of where prices might go in the future. It’s like having a tool that can read market emotions and predict potential volatility in prices.
Advantages of using Technical Analysis in Forex Trading
- Timing Entry and Exit Points: Forex chart patterns and technical indicators may help investors identify possible entry and exit points, allowing them to maximize potential gains and minimize losses.
- Risk Management: By recognizing support and resistance levels, technical analysis may assist in setting stop-loss orders to potentially manage risk in trading.
- Insight into Market Sentiment: Examining chart patterns is akin to getting a sneak peek into how traders feel about the market, aiding in identifying the current trend.
- Adaptability: Technical analysis in the forex market works across various asset classes, from stocks to forex, commodities, and cryptocurrencies.
- Spotting Trends: Traders can use technical analysis to identify potential trends and gauge prevailing market sentiment, assisting them to ride bullish trends and avoid bearish pitfalls.
Navigating the forex market without the guidance of Technical Analysis in the Forex Market is akin to sailing without a map – you’re likely to drift aimlessly.
How can Technical Analysis in the Forex Market be used?
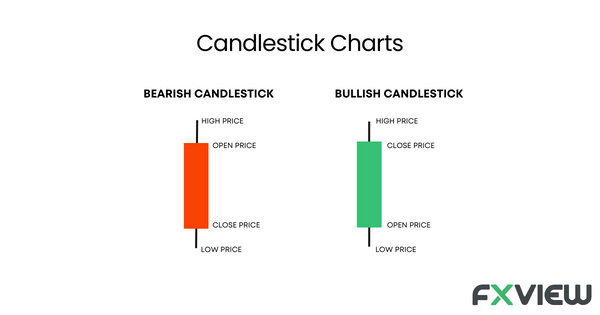
Candlestick Charts: These candlestick charts may reveal price trends and reversals through patterns like doji, engulfing, and hammering in the forex market.
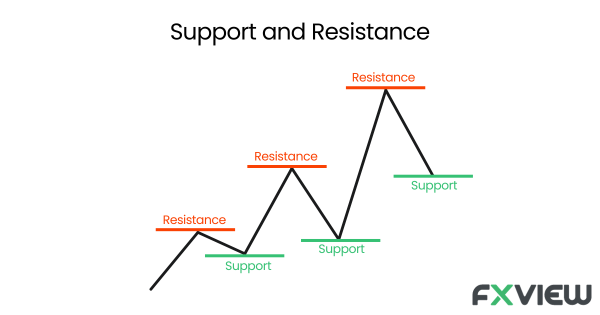
Support and Resistance Levels: These levels can indicate where a forex pair’s price tends to find support or resistance, helping determine entry and exit points.
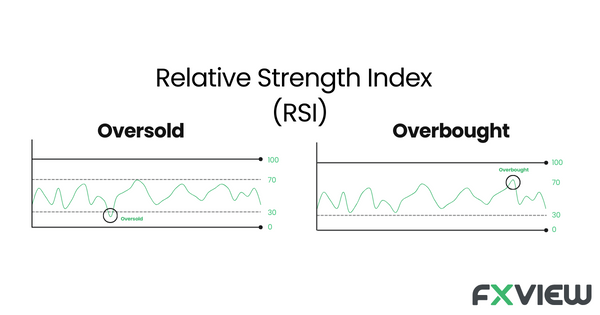
Relative Strength Index (RSI): RSI can measure the speed and change of price movements and may help identify overbought or oversold conditions, indicating potential reversals.
Fibonacci Retracements: Based on the Fibonacci sequence, these retracement levels may help identify potential support and resistance levels, enabling traders to set potentially good targets and stop-loss orders.
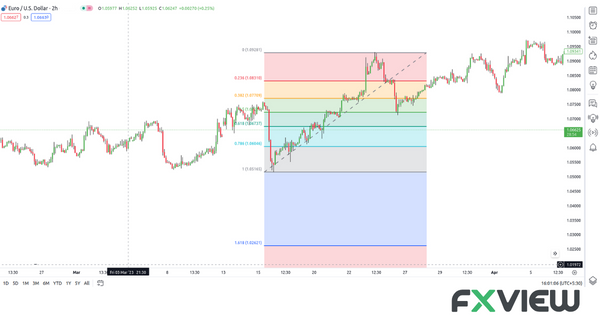
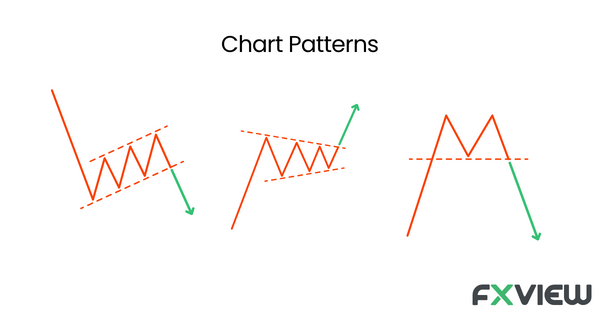
Chart patterns: Patterns such as head and shoulders, double tops and bottoms, triangles, and flags can be used to predict potential price moves in the forex market.
These technical analysis tools, when used judiciously, can provide valuable insights and enhance a trader’s ability to make informed decisions in the dynamic forex market.
Limitations of Technical Analysis in the Forex Market
- Subjectivity: Different analysts may interpret the same chart differently, leading to potential disparities in trading decisions.
- Unexpected Events: Technical analysis may not account for sudden market shifts due to unforeseen events or news, therefore solely relying on trading tools might be risky for traders.
- Incomplete Information: Technical Analysis in the Forex Market doesn’t consider fundamental factors like earnings, company management, or economic indicators.
- Past Performance: Critics argue that technical analysis solely relies on historical data, making it susceptible to overlooking dynamic market shifts or unforeseen events. Always keep in mind that past performance may not be indicative of future results.
Even the sharpest tools have their limitations; technical analysis, while powerful, isn’t a crystal ball that can predict the future with certainty.
Technical vs. Fundamental Analysis in the Forex Market
- Data Used: Technical Analysis in the Forex Market utilizes historical price and volume data, while fundamental analysis can examine financial statements, earnings reports, and economic indicators.
- Time Horizon: Technical analysis might be more approachable for short- to medium-term trading, while fundamental analysis may often be applied for long-term investment decisions.
- Market Participants: Traders and short-term investors might be more likely to use technical analysis, while long-term investors and value seekers may prefer fundamental analysis.
In the battle between Technical and Fundamental Analysis, it’s like pitting artistry against arithmetic, but both have their place in the grand symphony of trading.
Key Takeaways
- Technical Analysis in the Forex Market involves examining historical price and volume data to identify patterns and trends in the forex market.
- It can help traders make informed decisions by providing insights into market sentiment, entry and exit points, and risk management.
- Common technical analysis tools include candlestick charts, moving averages, support and resistance levels, RSI, and Fibonacci retracements.
- However, technical analysis has limitations, including subjectivity, susceptibility to unexpected events, and a focus on past performance.
- It differs from fundamental analysis, which considers financial statements and economic indicators and is often used for long-term investment decisions.
- When used wisely and in combination with other analytical methods, technical analysis can enhance traders’ confidence and decision-making in the forex market.
Conclusion
Technical Analysis in the Forex Market emerges as an important tool, assisting traders through the labyrinth of possibilities. When used wisely and in conjunction with other analytical methods, technical analysis may contribute to more informed trading decisions in the challenging world of Forex.
As you set sail on your financial voyage, remember the timeless adage: “Forewarned is forearmed.” Armed with the knowledge of technical analysis, you may navigate the ever-shifting tides of the financial markets with more confidence.
With Fxview’s online trading platforms, you can do the Technical Analysis on MT4, MT5 and ActTrader.
Disclaimer: The information contained in this article is provided for educational and informational purposes only and it is not intended to be, nor does it constitute financial, investment, or trading advice. You should not make any financial, investment, or trading decisions based on the information provided in this article without performing your own research or seeking advice from an independent advisor.